
PTE Describe Image template for 12 image types
A sentence plan for each of the 12 image types, from line graphs to photos, with the linking words to join them.

Par Thanh Tran, cofondation et enseignement du PTE
Mis à jour en
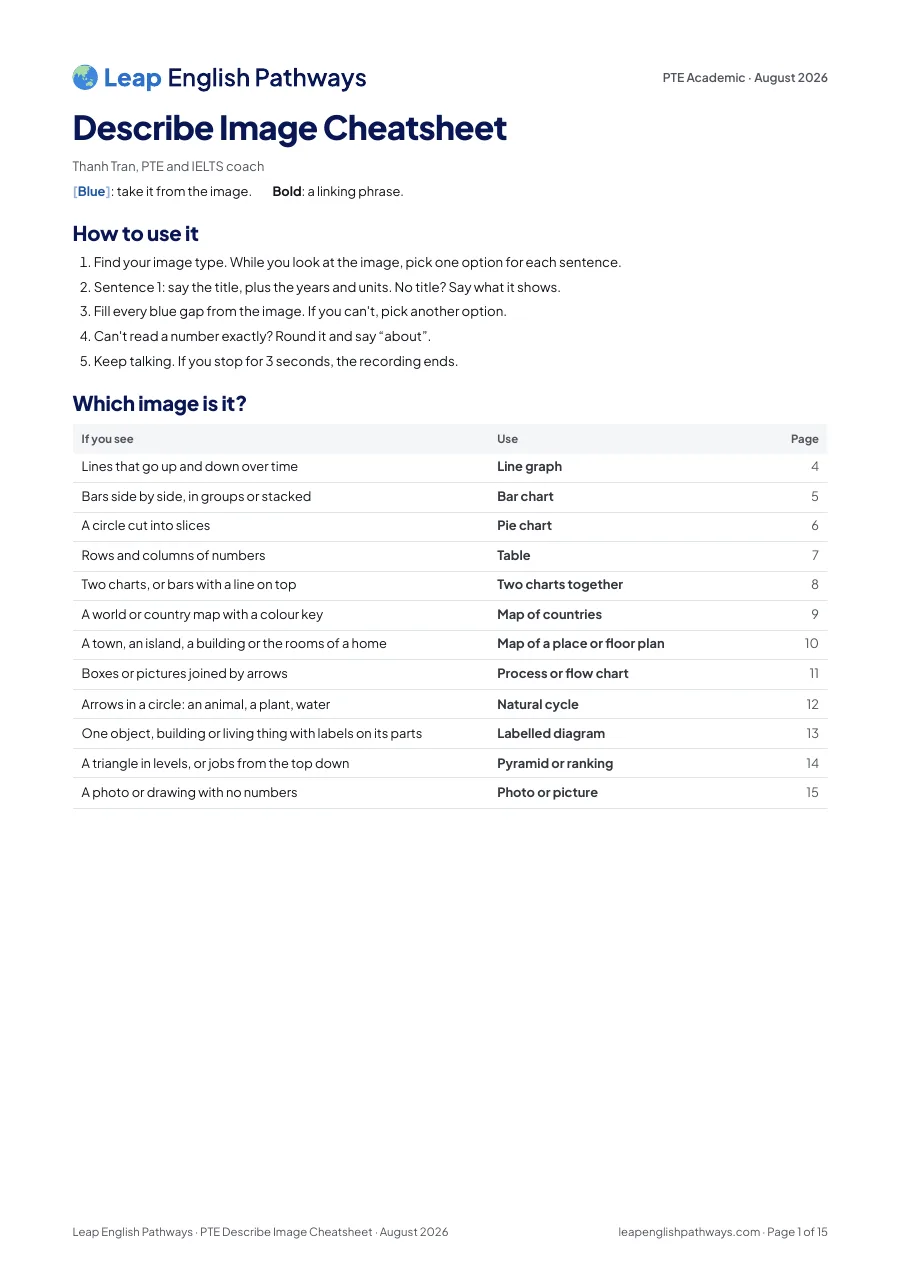
Which image is it?
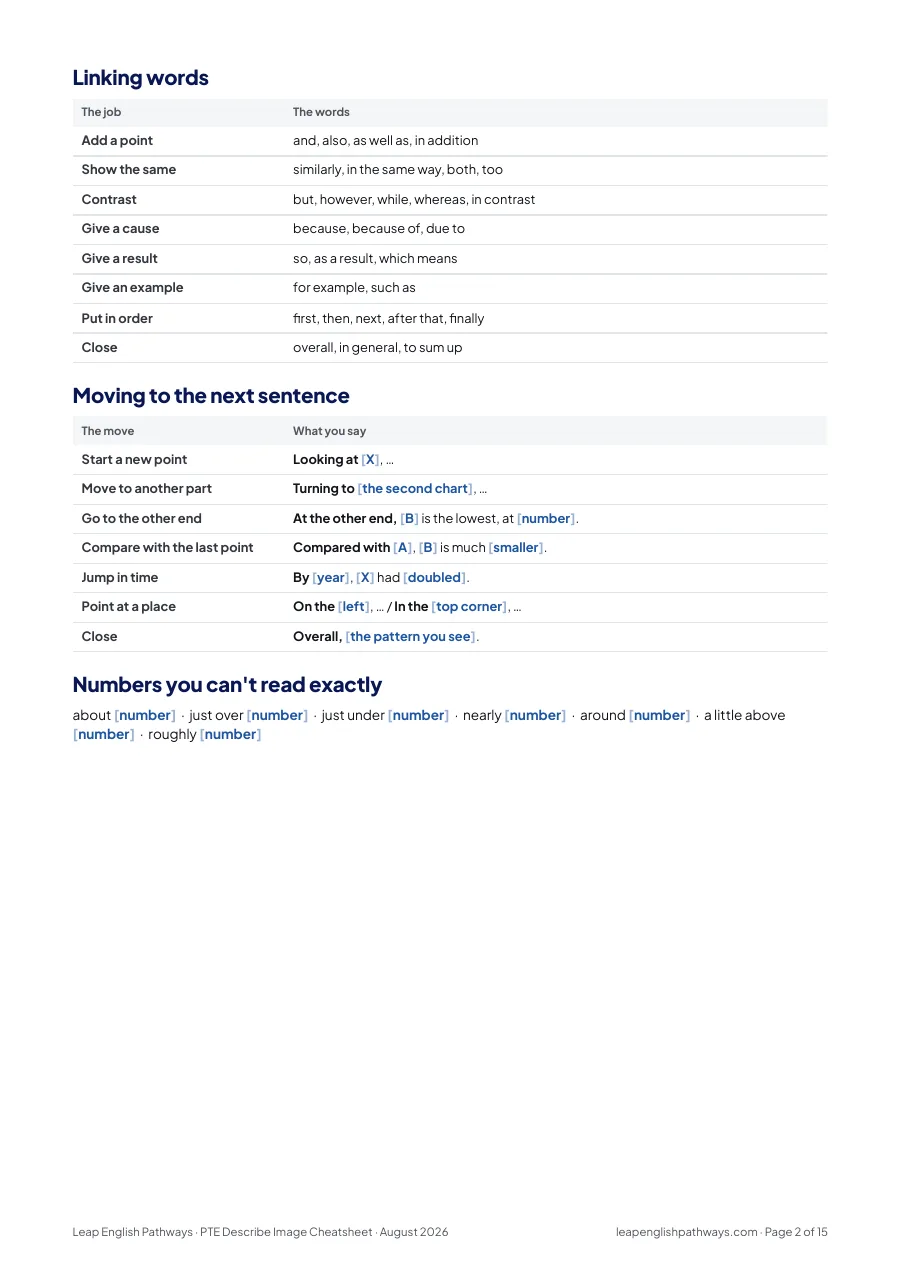
Pick the kind of image you see. Its template opens.
Blue: take it from the image.Bold: a linking phrase.
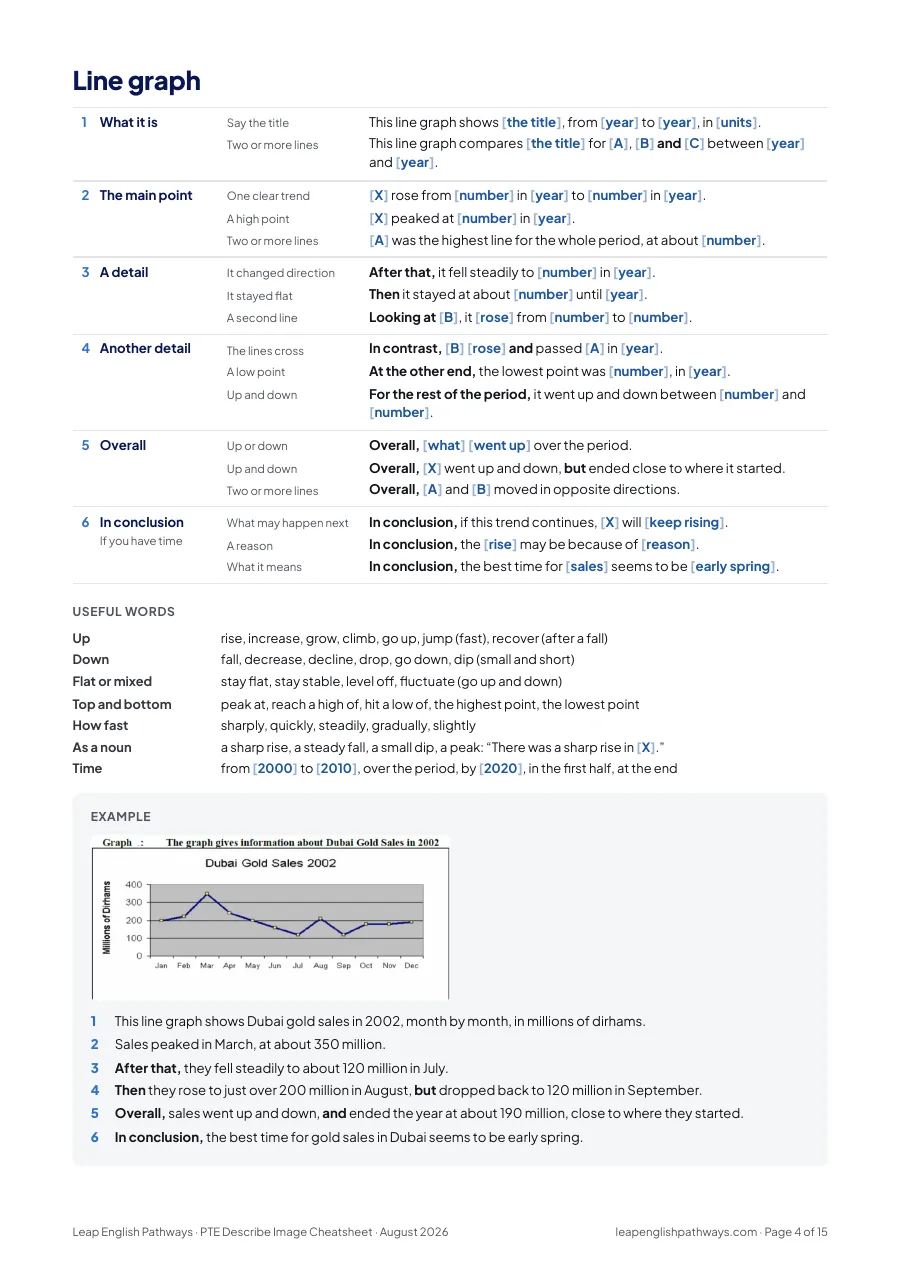
- What it is
- Say the titleThis line graph shows the title, from year to year, in units.
- Two or more linesThis line graph compares the title for A, B and C between year and year.
- The main point
- One clear trendX rose from number in year to number in year.
- A high pointX peaked at number in year.
- Two or more linesA was the highest line for the whole period, at about number.
- A detail
- It changed directionAfter that, it fell steadily to number in year.
- It stayed flatThen it stayed at about number until year.
- A second lineLooking at B, it rose from number to number.
- Another detail
- The lines crossIn contrast, B rose and passed A in year.
- A low pointAt the other end, the lowest point was number, in year.
- Up and downFor the rest of the period, it went up and down between number and number.
- Overall
- Up or downOverall, what went up over the period.
- Up and downOverall, X went up and down, but ended close to where it started.
- Two or more linesOverall, A and B moved in opposite directions.
- In conclusionIf you have time
- What may happen nextIn conclusion, if this trend continues, X will keep rising.
- A reasonIn conclusion, the rise may be because of reason.
- What it meansIn conclusion, the best time for sales seems to be early spring.
- What it is
- Say the titleThis bar chart shows the title, across number groups, in units.
- Groups of barsThis bar chart compares the title for number groups at number times or places.
- The main point
- One clear leaderA has the highest bar, at about number.
- Groups of barsThe highest bar of all is A at time, with about number.
- A detail
- Second placeAfter that comes B, at about number.
- Inside one groupLooking at group, the figures fall from number to number.
- Two barsBy comparison, A is about twice as high as B.
- Another detail
- The lowestAt the other end, C is the lowest, with only number.
- A different patternIn contrast, B is highest at time, with number.
- Overall
- One leaderOverall, A leads, while C comes last.
- Groups of barsOverall, each group is highest at a different time.
- In conclusionIf you have time
- What it meansIn conclusion, people seem to prefer A at time.
- A reasonIn conclusion, this may be because reason.
- What it is
- Say the titleThis pie chart shows the title, split into number parts.
- Two piesThese two pie charts compare the title in year and year.
- The main point
- One big sliceThe largest share is A, at number percent.
- Two piesIn year, the largest share was A, at number percent.
- A detail
- The next sliceThis is followed by B, at number percent.
- Add two slicesA and B together make up more than half.
- Another detail
- The smallestAt the other end, C is the smallest, at only number percent.
- Two piesBy year, A had grown to number percent.
- Overall
- One pieOverall, most people do what, and only a small part do what.
- Two piesOverall, the biggest change is in A, which doubled.
- In conclusionIf you have time
- What it meansIn conclusion, most people seem to live close to work.
- A reasonIn conclusion, this may be because reason.
- What it is
- Say the titleThis table shows the title, for number rows.
- Years as columnsThis table compares the title for number rows in year and year.
- The main point
- The top figureA has the highest figure, at number.
- One row leadsA is the highest in every column.
- A detail
- Second placeNext comes B, at about number.
- A changeBetween the two years, A rose from number to number.
- Another detail
- The lowestAt the other end, C has the lowest figure, at number.
- The opposite changeIn contrast, D fell from number to number.
- Overall
- One leaderOverall, A is ahead on what.
- Little changeOverall, the figures changed very little between year and year.
- In conclusionIf you have time
- What may happen nextIn conclusion, A is likely to stay ahead in the coming years.
- A reasonIn conclusion, this may be because reason.
- What it is
- Two chartsThere are two charts here. The first shows title one, and the second shows title two.
- Bars and a lineThis chart shows the title: rainfall and temperature, month by month.
- The main point
- Start with one chartIn the first chart, A is the highest, at number.
- Bars and a lineThe bars show X, which peaks in month at about number units.
- A detail
- The second chartIn the second chart, B leads, at number.
- The bars againAfter that, X drops sharply, to about number in month.
- Another detail
- They agreeBoth charts show that as X rises, Y rises too.
- They disagreeA is highest in the first chart, but lowest in the second.
- The lineMeanwhile, the line shows Y, which stays between number and number.
- Overall
- Two chartsTogether, the charts show that what.
- Bars and a lineOverall, X changes a lot, while Y stays almost the same.
- In conclusionIf you have time
- Link the twoIn conclusion, X may be one reason for Y.
- What it meansIn conclusion, the best time to visit is month, when what.
- What it is
- Say the titleThis world map shows the title, country by country, in year.
- One countryThis map shows the title across the states of country.
- The main point
- The top groupThe highest figures, above number, are in countries such as country and country.
- One stands outCountry stands out, with the darkest colour on the map.
- A detail
- The next groupNext come region and region, at number to number.
- Where it isMost of the high figures are along the coast, especially in the south-east.
- Another detail
- The bottom groupIn contrast, most of region is below number.
- No dataHowever, there is no data for place, which is grey.
- Overall
- Any mapOverall, what is highest in region and lowest in region.
- SpreadOverall, most of the people live in region, while region is almost empty.
- In conclusionIf you have time
- What it meansIn conclusion, there is a big gap between rich and poor regions.
- A reasonIn conclusion, this may be linked to climate.
- What it is
- Say the titleThis map shows the title, with main features.
- No titleThis floor plan shows a flat with number rooms.
- Two mapsThese two maps show place in year and in year.
- The main point
- The biggest partThe largest room is A, in the top left.
- In the centreIn the centre is A, which is the main feature.
- A detail
- Next to itNext to A, on the right, is B.
- A changeBy year, X had been replaced by Y.
- Another detail
- Below or oppositeBelow A are C and D.
- Along the edgeE runs along the south side, opposite F.
- Overall
- Floor planOverall, the bedrooms are on the left, and the living areas are on the right.
- Two mapsOverall, place has become more built up.
- In conclusionIf you have time
- Who it suitsIn conclusion, this flat would suit a small family.
- What may happen nextIn conclusion, the area will probably keep growing.
- What it is
- Say the titleThis diagram shows the title, in number stages.
- No titleThis diagram shows how thing is made, in number stages.
- Steps for a personThis flow chart shows the steps to do something.
- The main point
- The first stepFirst, thing is collected from place.
- Start and endThe process starts with step and ends with step.
- A detail
- The middleNext, it is washed and taken to place.
- A choiceIf condition, it goes to step. If not, it goes back to step.
- Another detail
- Later stepsAfter that, it is heated and made into thing.
- At the same timeAt the same time, other thing happens.
- Overall
- It endsFinally, step, and the product is ready.
- It repeatsFinally, step, so the process is a cycle that repeats.
- In conclusionIf you have time
- Why it mattersIn conclusion, this process helps to reduce waste.
- What it needsIn conclusion, the process needs machines at every stage.
- What it is
- Say the titleThis diagram shows the title, in number stages.
- Life cycleThis diagram shows the life cycle of a frog, in number stages.
- Water or weatherThis diagram shows how water moves between the sea, the air and the land.
- The main point
- Start and endIt starts as an egg, and ends as an adult.
- WaterFirst, the sun heats the sea, and the water evaporates.
- A detail
- It growsFirst, the egg hatches into a tadpole.
- WaterAs the water vapour rises, it cools and forms clouds.
- Another detail
- It changesNext, the tadpole grows legs and turns into a young frog.
- WaterAfter that, it falls as rain and flows back into the sea.
- Overall
- It starts againFinally, the adult lays eggs, so the cycle starts again.
- No start or endOverall, it is a cycle that never stops.
- In conclusionIf you have time
- How it changesIn conclusion, the animal changes completely, from what to what.
- Why it mattersIn conclusion, life on earth depends on this cycle.
- What it is
- Say the titleThis diagram shows the title and its main parts.
- How it worksThis diagram shows how thing works.
- The main point
- The main partThe main part is A, which does what.
- Top firstAt the top is A, which is made of material.
- A detail
- The next partBelow it is B, which holds up C.
- InsideInside A, there is B.
- Another detail
- A connectionC is connected to D, so what happens.
- At the bottomAt the bottom, E is below ground level.
- Overall
- TogetherOverall, these parts work together to do what.
- Simple designOverall, it is a simple home made from materials.
- In conclusionIf you have time
- What it is forIn conclusion, thing was built to keep people warm and dry.
- Compared with todayIn conclusion, it is very different from modern homes.
- What it is
- Say the titleThis pyramid shows the title, from the base to the top.
- No titleThis pyramid shows what people need, from the base to the top.
- Jobs or ranksThis chart shows the jobs in a company, from the top to the bottom.
- The main point
- The baseAt the base is A, the largest level.
- The topAt the top is A, the person in charge.
- A detail
- The next levelAbove that is B, and then C.
- The next level downBelow A are B, who report to A.
- Another detail
- Near the topNear the top is D, and at the very top is E.
- The bottomAt the bottom are E, the largest group.
- Overall
- Food or needsOverall, we need more of the things at the base and less of the things at the top.
- Jobs or ranksOverall, there are fewer people at each level as you go up.
- In conclusionIf you have time
- AdviceIn conclusion, to stay healthy, people should eat mostly from the base.
- What it meansIn conclusion, most decisions are made at the top.
- What it is
- PeopleThis photo shows who doing what in place.
- A place or objectThis picture shows a place or object, where or what for.
- The main point
- The main peopleIn the front, they are doing what.
- What stands outWhat stands out is thing, in the centre.
- A detail
- More detailOn the table, there are things.
- Left and rightOn the left, X. On the right, Y.
- Another detail
- The backgroundIn the background, Y.
- A differenceMost people are doing what, but one person is doing what.
- Overall
- Guess the situationIt looks like a lunch break between classes.
- The moodOverall, the photo shows a busy place.
- In conclusionIf you have time
- What happens nextIn conclusion, they will probably go back to class soon.
- What it showsIn conclusion, the photo shows that friends matter in student life.
Essayez maintenant sur une vraie question
Répondez à une question Describe Image dans notre application d'entraînement. Notre système de correction la note en quelques secondes : vous savez quoi corriger ensuite.
How to use it
Find your image type. While you look at the image, pick one option for each sentence.
Sentence 1: say the title, plus the years and units. No title? Say what it shows.
Fill every blue gap from the image. If you can't, pick another option.
Can't read a number exactly? Round it and say “about”.
Keep talking. If you stop for 3 seconds, the recording ends.
An example answer
The line graph template, used on a real question. The PDF has an example answer for all 12 templates.
- This line graph shows Dubai gold sales in 2002, month by month, in millions of dirhams.
- Sales peaked in March, at about 350 million.
- After that, they fell steadily to about 120 million in July.
- Then they rose to just over 200 million in August, but dropped back to 120 million in September.
- Overall, sales went up and down, and ended the year at about 190 million, close to where they started.
- In conclusion, the best time for gold sales in Dubai seems to be early spring.
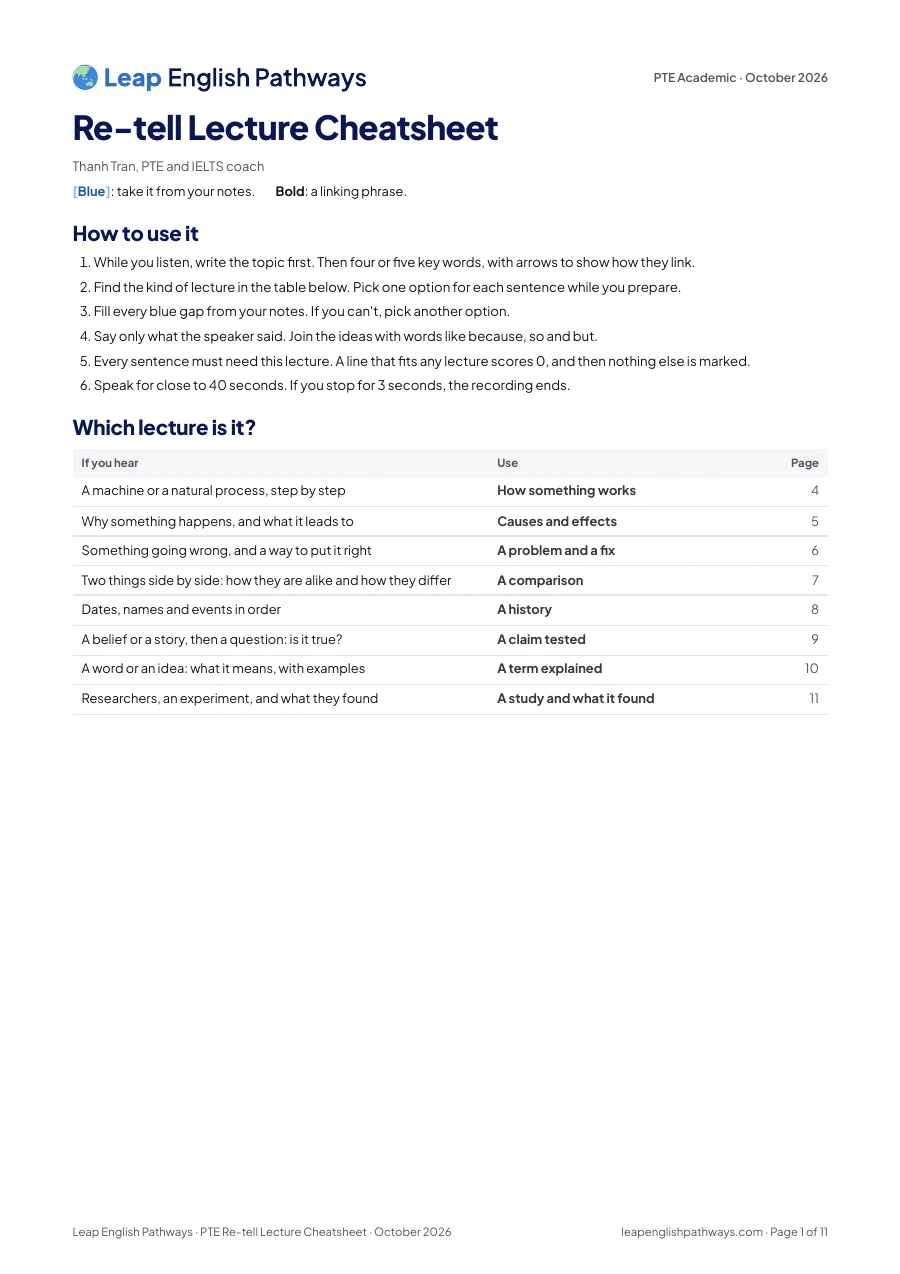
PTE Describe Image : durée et notationLes templates sont-ils autorisés au PTE ?
Questions fréquentes
Are templates allowed in PTE Describe Image?
Which image types does the cheat sheet cover?
How do I use it in the 25 seconds?
How long should I speak in Describe Image?
Is the PDF free?
Recevez votre PDF : Describe Image template