
PTE Describe Image template for 12 image types
A sentence plan for each of the 12 image types, from line graphs to photos, with the linking words to join them.

By Thanh Tran, co-founder and PTE instructor
Updated
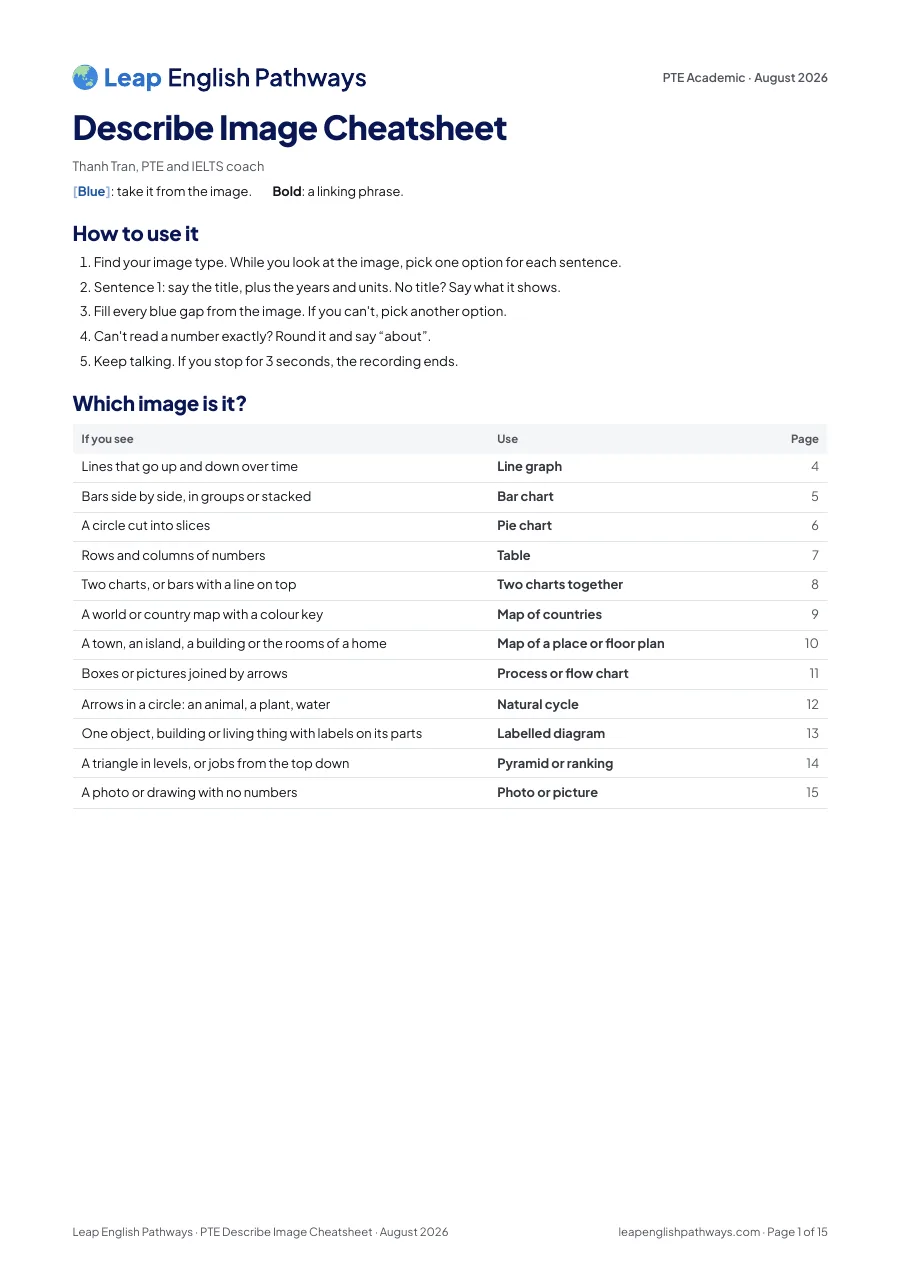
Which image is it?
The cheat sheet has a page for each of the 12 kinds of image. Find yours here, then turn to its page.
- Page 4
Line graph
Lines that go up and down over time
- Page 5
Bar chart
Bars side by side, in groups or stacked
- Page 6
Pie chart
A circle cut into slices
- Page 7
Table
Rows and columns of numbers
- Page 8
Two charts together
Two charts, or bars with a line on top
- Page 9
Map of countries
A world or country map with a colour key
- Page 10
Map of a place or floor plan
A town, an island, a building or the rooms of a home
- Page 11
Process or flow chart
Boxes or pictures joined by arrows
- Page 12
Natural cycle
Arrows in a circle: an animal, a plant, water
- Page 13
Labelled diagram
One object, building or living thing with labels on its parts
- Page 14
Pyramid or ranking
A triangle in levels, or jobs from the top down
- Page 15
Photo or picture
A photo or drawing with no numbers
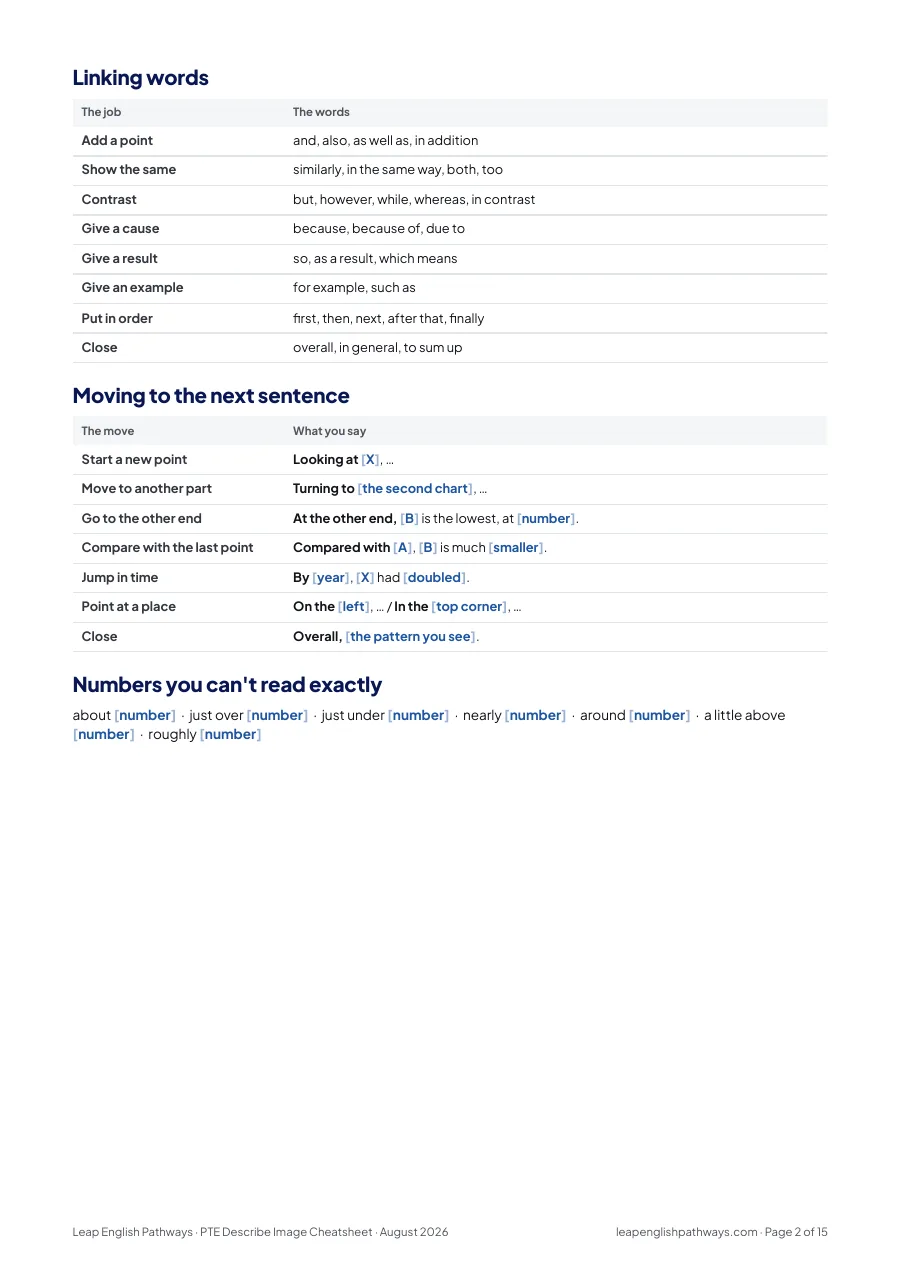
How to use it
Find your image type. While you look at the image, pick one option for each sentence.
Sentence 1: say the title, plus the years and units. No title? Say what it shows.
Fill every blue gap from the image. If you can't, pick another option.
Can't read a number exactly? Round it and say “about”.
Keep talking. If you stop for 3 seconds, the recording ends.
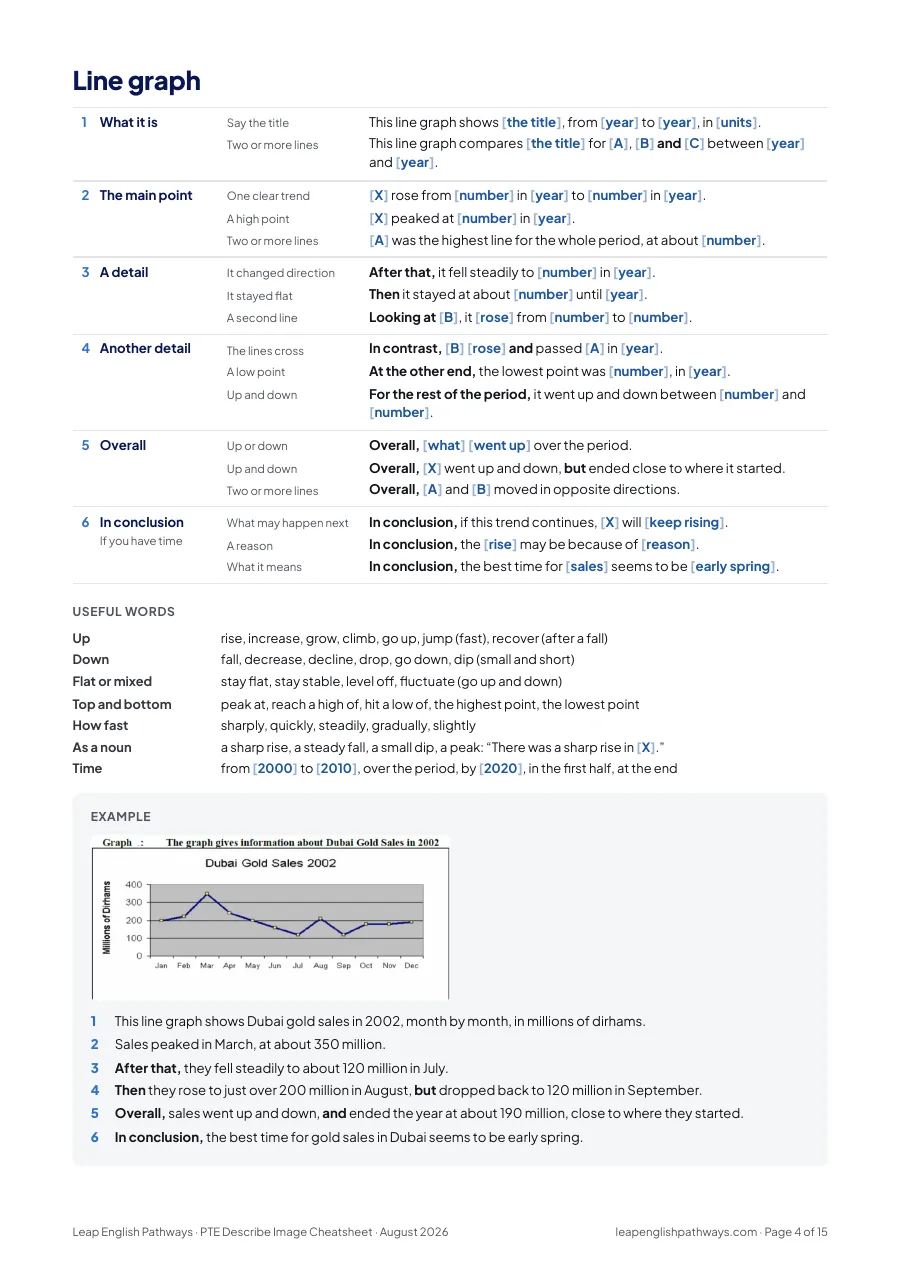
The line graph template
Page 4 of the cheat sheet, as it prints. Pick one option for each sentence and fill the blue gaps.
Blue: take it from the image.Bold: a linking phrase.
- What it is
- Say the titleThis line graph shows the title, from year to year, in units.
- Two or more linesThis line graph compares the title for A, B and C between year and year.
- The main point
- One clear trendX rose from number in year to number in year.
- A high pointX peaked at number in year.
- Two or more linesA was the highest line for the whole period, at about number.
- A detail
- It changed directionAfter that, it fell steadily to number in year.
- It stayed flatThen it stayed at about number until year.
- A second lineLooking at B, it rose from number to number.
- Another detail
- The lines crossIn contrast, B rose and passed A in year.
- A low pointAt the other end, the lowest point was number, in year.
- Up and downFor the rest of the period, it went up and down between number and number.
- Overall
- Up or downOverall, what went up over the period.
- Up and downOverall, X went up and down, but ended close to where it started.
- Two or more linesOverall, A and B moved in opposite directions.
- In conclusionIf you have time
- What may happen nextIn conclusion, if this trend continues, X will keep rising.
- A reasonIn conclusion, the rise may be because of reason.
- What it meansIn conclusion, the best time for sales seems to be early spring.
- This line graph shows Dubai gold sales in 2002, month by month, in millions of dirhams.
- Sales peaked in March, at about 350 million.
- After that, they fell steadily to about 120 million in July.
- Then they rose to just over 200 million in August, but dropped back to 120 million in September.
- Overall, sales went up and down, and ended the year at about 190 million, close to where they started.
- In conclusion, the best time for gold sales in Dubai seems to be early spring.
Practise Describe ImagePTE Describe Image: timing and scoringAre templates allowed in PTE?
Common questions
Are templates allowed in PTE Describe Image?
Which image types does the cheat sheet cover?
How do I use it in the 25 seconds?
How long should I speak in Describe Image?
Is the PDF free?
Get the Describe Image template