
PTE Describe Image template for 12 image types
A sentence plan for each of the 12 image types, from line graphs to photos, with the linking words to join them.

글: Thanh Tran, 공동 설립자 겸 PTE 강사
업데이트
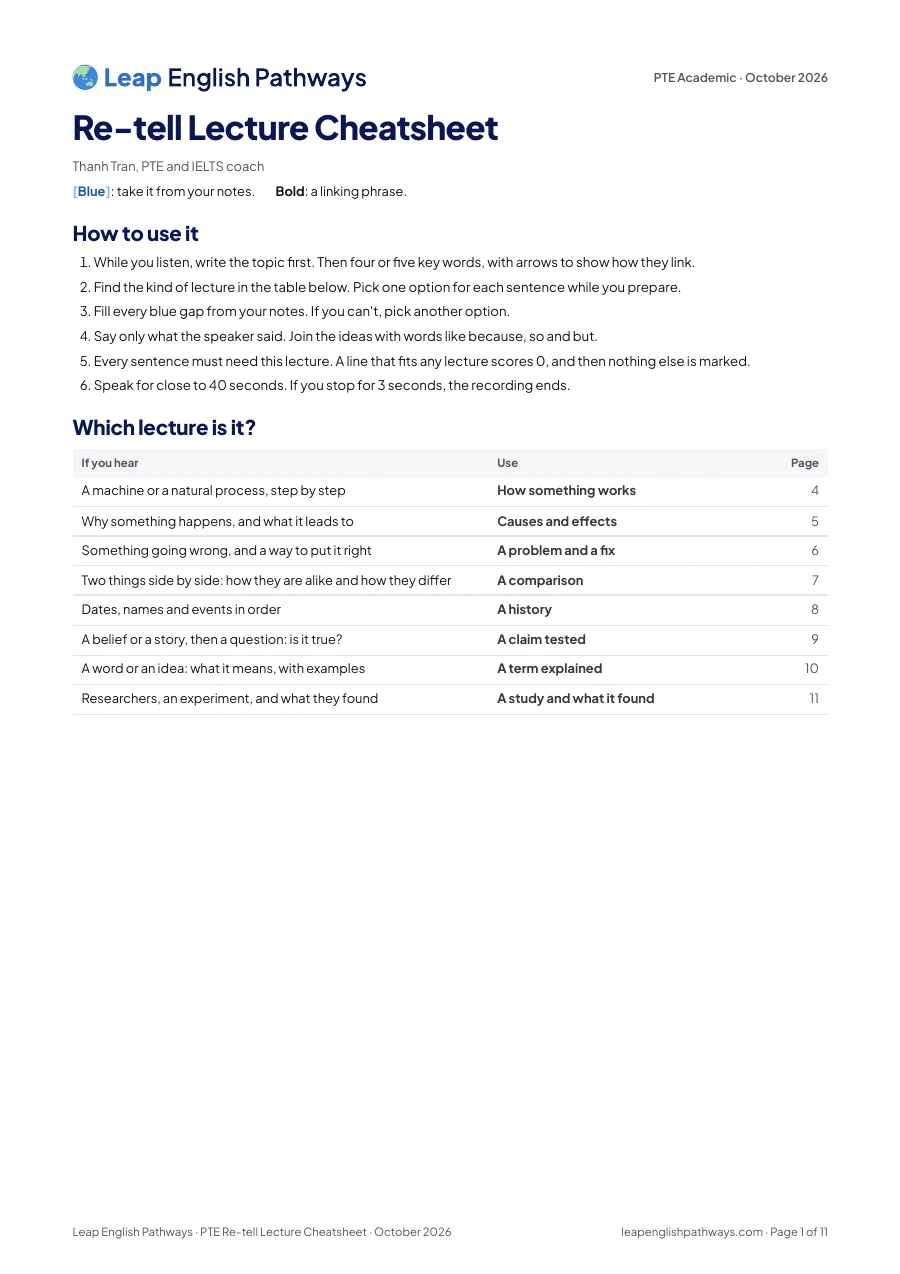
Which image is it?
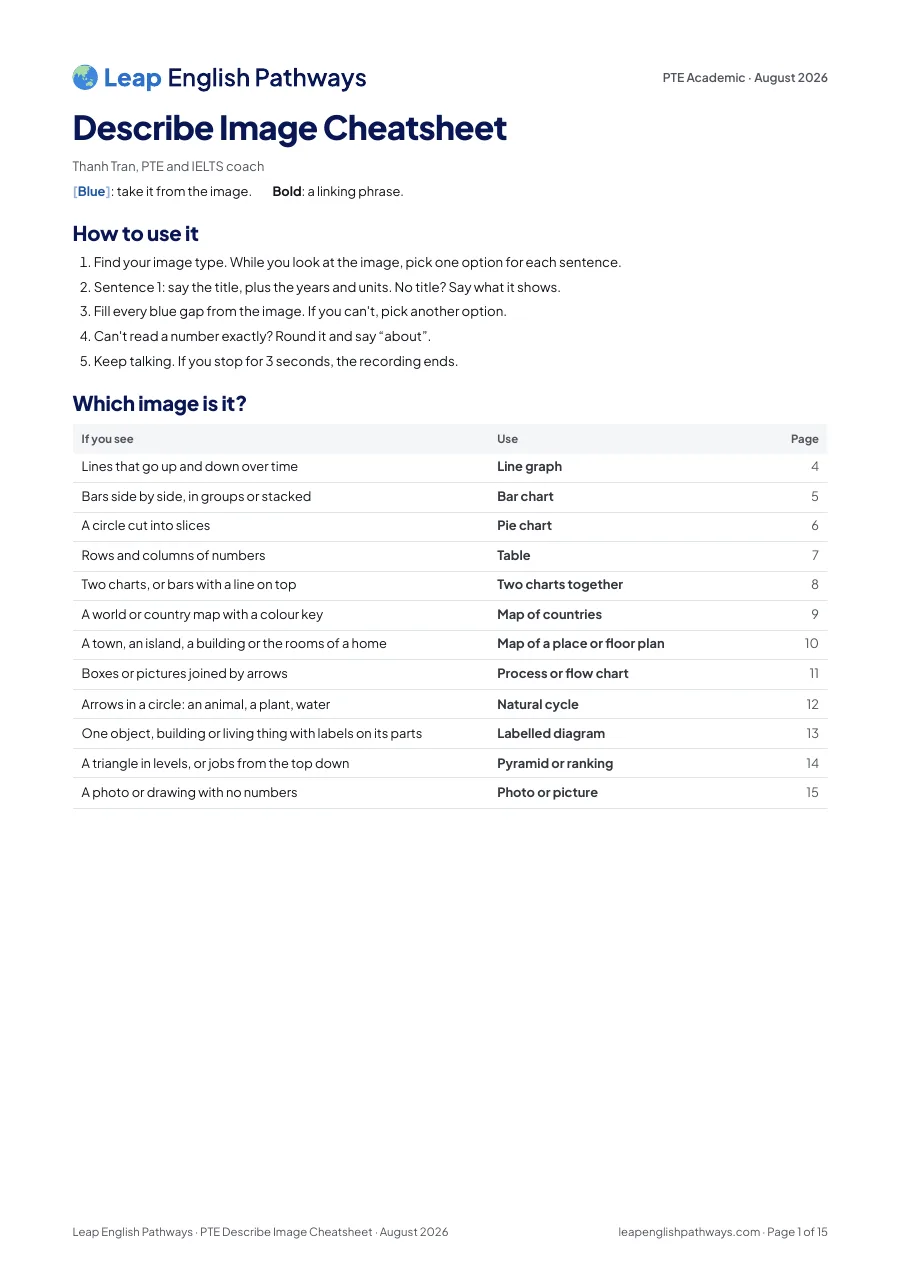
Pick the kind of image you see. Its template opens.
Blue: take it from the image.Bold: a linking phrase.
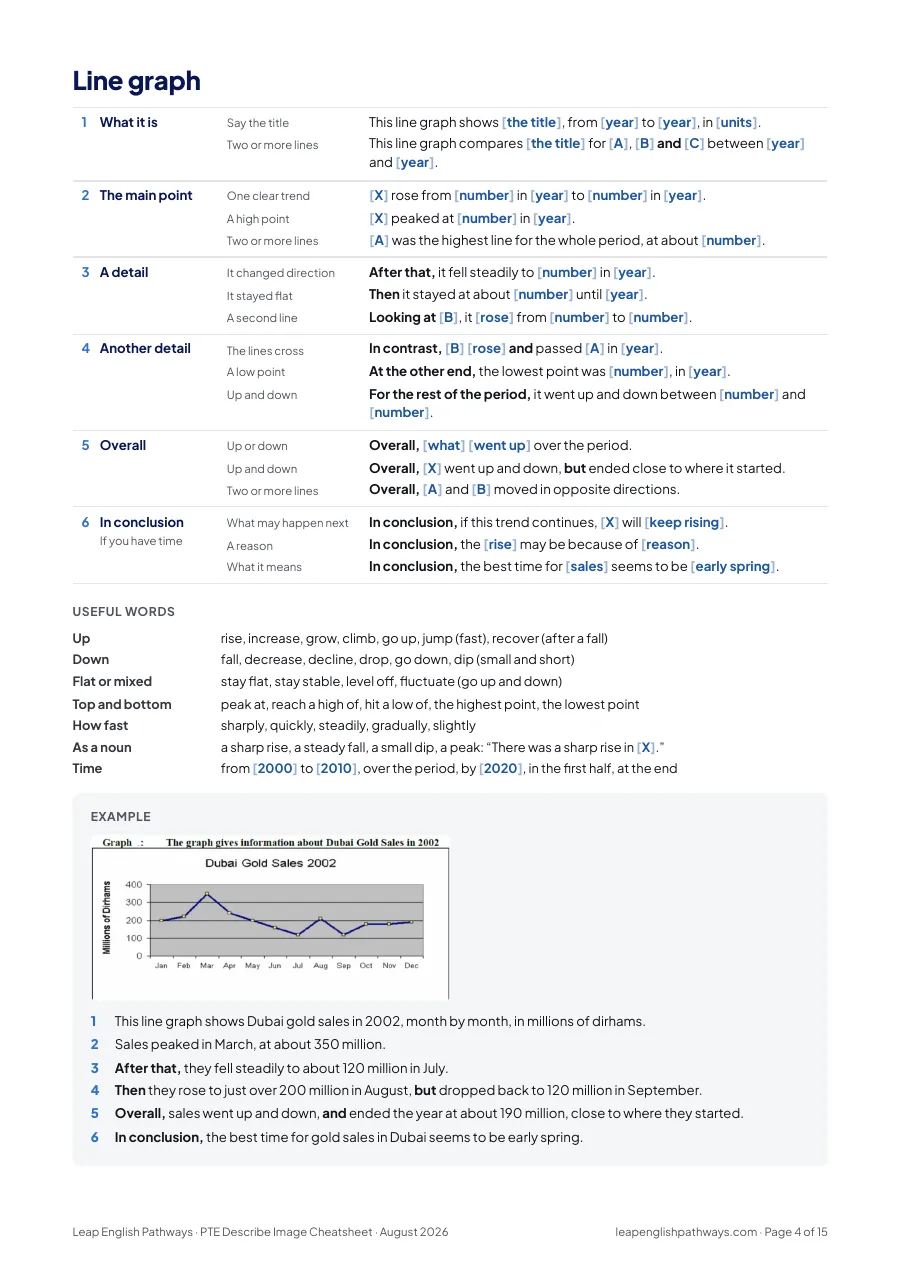
- What it is
- Say the titleThis line graph shows the title, from year to year, in units.
- Two or more linesThis line graph compares the title for A, B and C between year and year.
- The main point
- One clear trendX rose from number in year to number in year.
- A high pointX peaked at number in year.
- Two or more linesA was the highest line for the whole period, at about number.
- A detail
- It changed directionAfter that, it fell steadily to number in year.
- It stayed flatThen it stayed at about number until year.
- A second lineLooking at B, it rose from number to number.
- Another detail
- The lines crossIn contrast, B rose and passed A in year.
- A low pointAt the other end, the lowest point was number, in year.
- Up and downFor the rest of the period, it went up and down between number and number.
- Overall
- Up or downOverall, what went up over the period.
- Up and downOverall, X went up and down, but ended close to where it started.
- Two or more linesOverall, A and B moved in opposite directions.
- In conclusionIf you have time
- What may happen nextIn conclusion, if this trend continues, X will keep rising.
- A reasonIn conclusion, the rise may be because of reason.
- What it meansIn conclusion, the best time for sales seems to be early spring.
- What it is
- Say the titleThis bar chart shows the title, across number groups, in units.
- Groups of barsThis bar chart compares the title for number groups at number times or places.
- The main point
- One clear leaderA has the highest bar, at about number.
- Groups of barsThe highest bar of all is A at time, with about number.
- A detail
- Second placeAfter that comes B, at about number.
- Inside one groupLooking at group, the figures fall from number to number.
- Two barsBy comparison, A is about twice as high as B.
- Another detail
- The lowestAt the other end, C is the lowest, with only number.
- A different patternIn contrast, B is highest at time, with number.
- Overall
- One leaderOverall, A leads, while C comes last.
- Groups of barsOverall, each group is highest at a different time.
- In conclusionIf you have time
- What it meansIn conclusion, people seem to prefer A at time.
- A reasonIn conclusion, this may be because reason.
- What it is
- Say the titleThis pie chart shows the title, split into number parts.
- Two piesThese two pie charts compare the title in year and year.
- The main point
- One big sliceThe largest share is A, at number percent.
- Two piesIn year, the largest share was A, at number percent.
- A detail
- The next sliceThis is followed by B, at number percent.
- Add two slicesA and B together make up more than half.
- Another detail
- The smallestAt the other end, C is the smallest, at only number percent.
- Two piesBy year, A had grown to number percent.
- Overall
- One pieOverall, most people do what, and only a small part do what.
- Two piesOverall, the biggest change is in A, which doubled.
- In conclusionIf you have time
- What it meansIn conclusion, most people seem to live close to work.
- A reasonIn conclusion, this may be because reason.
- What it is
- Say the titleThis table shows the title, for number rows.
- Years as columnsThis table compares the title for number rows in year and year.
- The main point
- The top figureA has the highest figure, at number.
- One row leadsA is the highest in every column.
- A detail
- Second placeNext comes B, at about number.
- A changeBetween the two years, A rose from number to number.
- Another detail
- The lowestAt the other end, C has the lowest figure, at number.
- The opposite changeIn contrast, D fell from number to number.
- Overall
- One leaderOverall, A is ahead on what.
- Little changeOverall, the figures changed very little between year and year.
- In conclusionIf you have time
- What may happen nextIn conclusion, A is likely to stay ahead in the coming years.
- A reasonIn conclusion, this may be because reason.
- What it is
- Two chartsThere are two charts here. The first shows title one, and the second shows title two.
- Bars and a lineThis chart shows the title: rainfall and temperature, month by month.
- The main point
- Start with one chartIn the first chart, A is the highest, at number.
- Bars and a lineThe bars show X, which peaks in month at about number units.
- A detail
- The second chartIn the second chart, B leads, at number.
- The bars againAfter that, X drops sharply, to about number in month.
- Another detail
- They agreeBoth charts show that as X rises, Y rises too.
- They disagreeA is highest in the first chart, but lowest in the second.
- The lineMeanwhile, the line shows Y, which stays between number and number.
- Overall
- Two chartsTogether, the charts show that what.
- Bars and a lineOverall, X changes a lot, while Y stays almost the same.
- In conclusionIf you have time
- Link the twoIn conclusion, X may be one reason for Y.
- What it meansIn conclusion, the best time to visit is month, when what.
- What it is
- Say the titleThis world map shows the title, country by country, in year.
- One countryThis map shows the title across the states of country.
- The main point
- The top groupThe highest figures, above number, are in countries such as country and country.
- One stands outCountry stands out, with the darkest colour on the map.
- A detail
- The next groupNext come region and region, at number to number.
- Where it isMost of the high figures are along the coast, especially in the south-east.
- Another detail
- The bottom groupIn contrast, most of region is below number.
- No dataHowever, there is no data for place, which is grey.
- Overall
- Any mapOverall, what is highest in region and lowest in region.
- SpreadOverall, most of the people live in region, while region is almost empty.
- In conclusionIf you have time
- What it meansIn conclusion, there is a big gap between rich and poor regions.
- A reasonIn conclusion, this may be linked to climate.
- What it is
- Say the titleThis map shows the title, with main features.
- No titleThis floor plan shows a flat with number rooms.
- Two mapsThese two maps show place in year and in year.
- The main point
- The biggest partThe largest room is A, in the top left.
- In the centreIn the centre is A, which is the main feature.
- A detail
- Next to itNext to A, on the right, is B.
- A changeBy year, X had been replaced by Y.
- Another detail
- Below or oppositeBelow A are C and D.
- Along the edgeE runs along the south side, opposite F.
- Overall
- Floor planOverall, the bedrooms are on the left, and the living areas are on the right.
- Two mapsOverall, place has become more built up.
- In conclusionIf you have time
- Who it suitsIn conclusion, this flat would suit a small family.
- What may happen nextIn conclusion, the area will probably keep growing.
- What it is
- Say the titleThis diagram shows the title, in number stages.
- No titleThis diagram shows how thing is made, in number stages.
- Steps for a personThis flow chart shows the steps to do something.
- The main point
- The first stepFirst, thing is collected from place.
- Start and endThe process starts with step and ends with step.
- A detail
- The middleNext, it is washed and taken to place.
- A choiceIf condition, it goes to step. If not, it goes back to step.
- Another detail
- Later stepsAfter that, it is heated and made into thing.
- At the same timeAt the same time, other thing happens.
- Overall
- It endsFinally, step, and the product is ready.
- It repeatsFinally, step, so the process is a cycle that repeats.
- In conclusionIf you have time
- Why it mattersIn conclusion, this process helps to reduce waste.
- What it needsIn conclusion, the process needs machines at every stage.
- What it is
- Say the titleThis diagram shows the title, in number stages.
- Life cycleThis diagram shows the life cycle of a frog, in number stages.
- Water or weatherThis diagram shows how water moves between the sea, the air and the land.
- The main point
- Start and endIt starts as an egg, and ends as an adult.
- WaterFirst, the sun heats the sea, and the water evaporates.
- A detail
- It growsFirst, the egg hatches into a tadpole.
- WaterAs the water vapour rises, it cools and forms clouds.
- Another detail
- It changesNext, the tadpole grows legs and turns into a young frog.
- WaterAfter that, it falls as rain and flows back into the sea.
- Overall
- It starts againFinally, the adult lays eggs, so the cycle starts again.
- No start or endOverall, it is a cycle that never stops.
- In conclusionIf you have time
- How it changesIn conclusion, the animal changes completely, from what to what.
- Why it mattersIn conclusion, life on earth depends on this cycle.
- What it is
- Say the titleThis diagram shows the title and its main parts.
- How it worksThis diagram shows how thing works.
- The main point
- The main partThe main part is A, which does what.
- Top firstAt the top is A, which is made of material.
- A detail
- The next partBelow it is B, which holds up C.
- InsideInside A, there is B.
- Another detail
- A connectionC is connected to D, so what happens.
- At the bottomAt the bottom, E is below ground level.
- Overall
- TogetherOverall, these parts work together to do what.
- Simple designOverall, it is a simple home made from materials.
- In conclusionIf you have time
- What it is forIn conclusion, thing was built to keep people warm and dry.
- Compared with todayIn conclusion, it is very different from modern homes.
- What it is
- Say the titleThis pyramid shows the title, from the base to the top.
- No titleThis pyramid shows what people need, from the base to the top.
- Jobs or ranksThis chart shows the jobs in a company, from the top to the bottom.
- The main point
- The baseAt the base is A, the largest level.
- The topAt the top is A, the person in charge.
- A detail
- The next levelAbove that is B, and then C.
- The next level downBelow A are B, who report to A.
- Another detail
- Near the topNear the top is D, and at the very top is E.
- The bottomAt the bottom are E, the largest group.
- Overall
- Food or needsOverall, we need more of the things at the base and less of the things at the top.
- Jobs or ranksOverall, there are fewer people at each level as you go up.
- In conclusionIf you have time
- AdviceIn conclusion, to stay healthy, people should eat mostly from the base.
- What it meansIn conclusion, most decisions are made at the top.
- What it is
- PeopleThis photo shows who doing what in place.
- A place or objectThis picture shows a place or object, where or what for.
- The main point
- The main peopleIn the front, they are doing what.
- What stands outWhat stands out is thing, in the centre.
- A detail
- More detailOn the table, there are things.
- Left and rightOn the left, X. On the right, Y.
- Another detail
- The backgroundIn the background, Y.
- A differenceMost people are doing what, but one person is doing what.
- Overall
- Guess the situationIt looks like a lunch break between classes.
- The moodOverall, the photo shows a busy place.
- In conclusionIf you have time
- What happens nextIn conclusion, they will probably go back to class soon.
- What it showsIn conclusion, the photo shows that friends matter in student life.
이제 실제 문제로 해 보세요
저희 연습 앱에서 Describe Image 문제 하나에 답해 보세요. 저희 엔진이 몇 초 만에 채점해서, 다음에 무엇을 고칠지 알려 드려요.
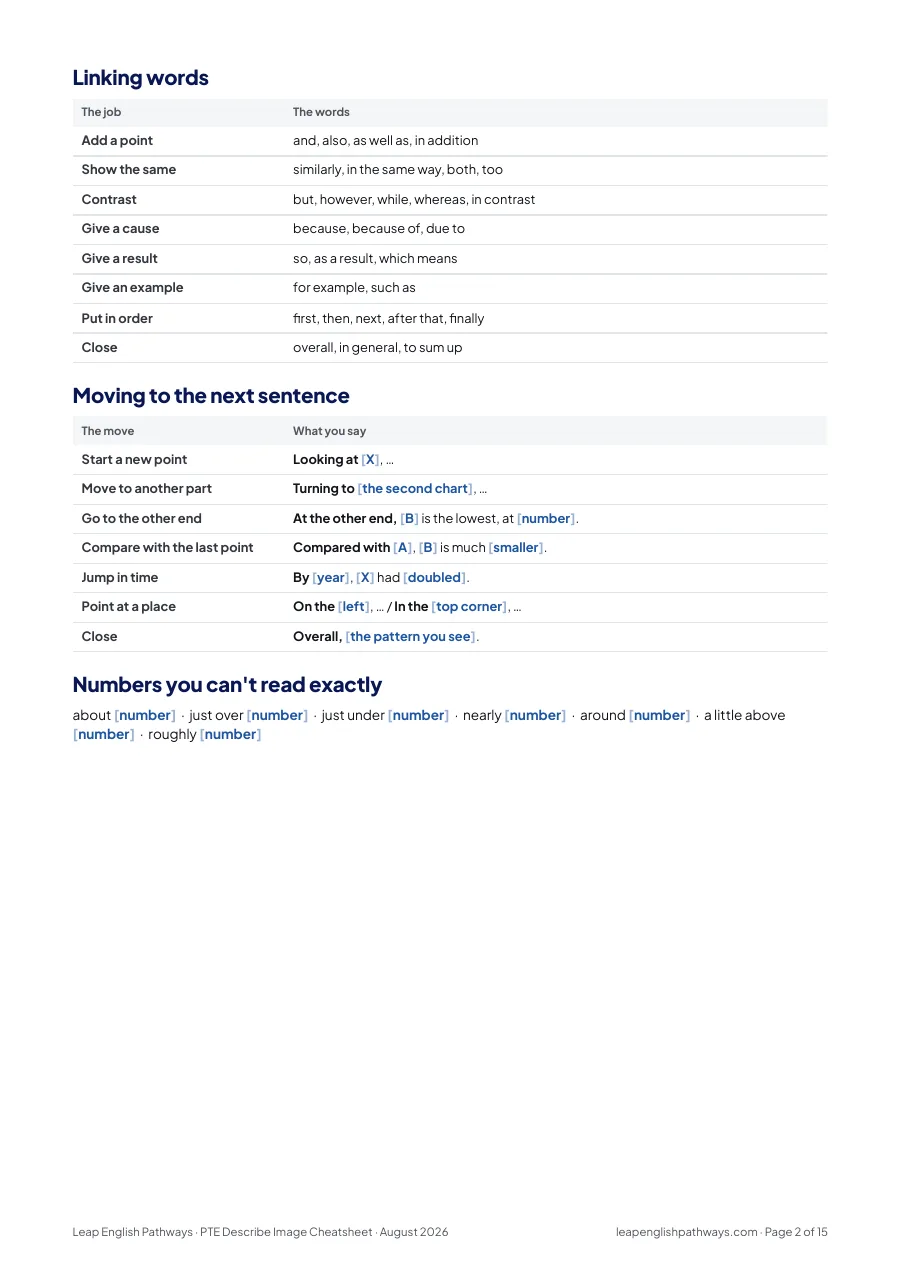
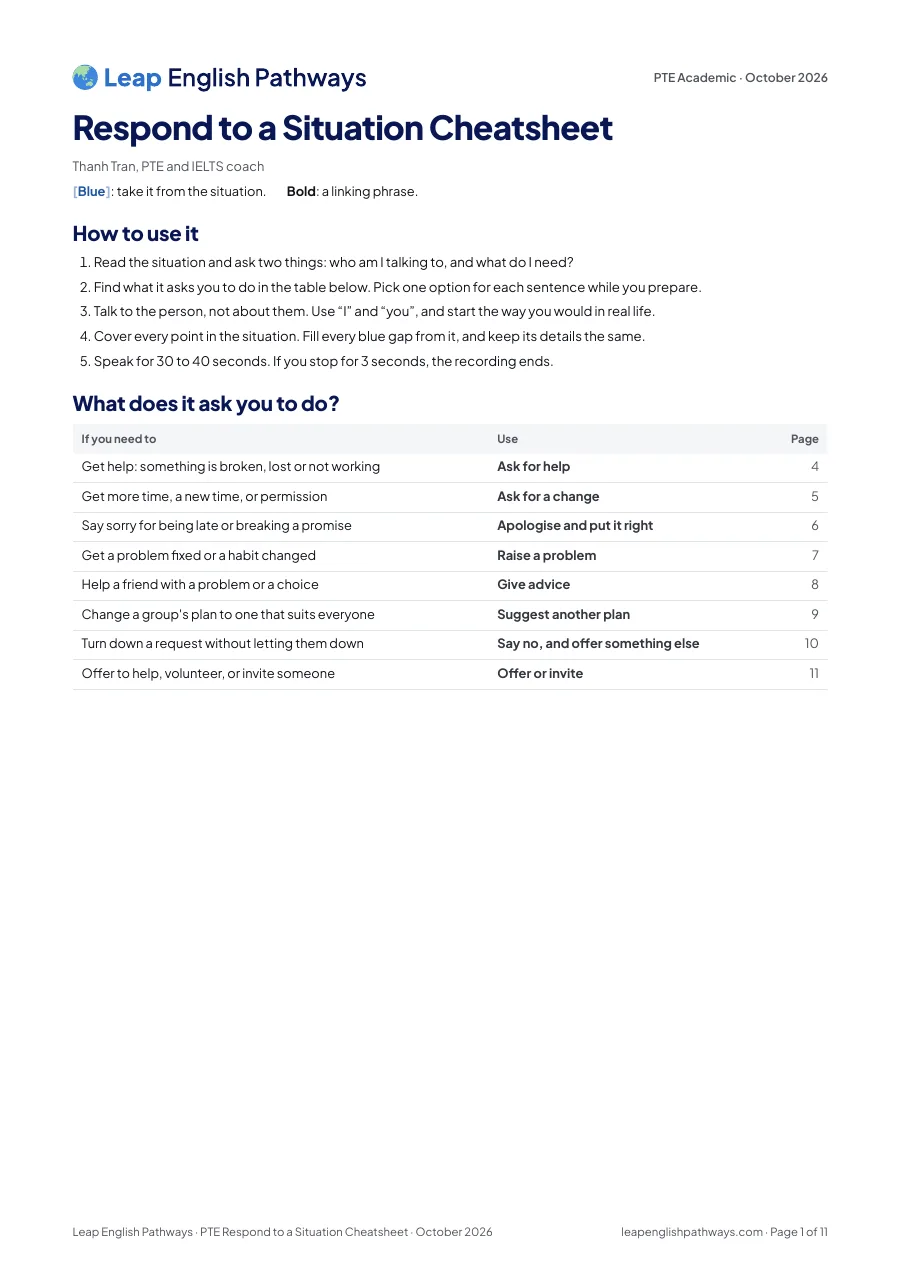
How to use it
Find your image type. While you look at the image, pick one option for each sentence.
Sentence 1: say the title, plus the years and units. No title? Say what it shows.
Fill every blue gap from the image. If you can't, pick another option.
Can't read a number exactly? Round it and say “about”.
Keep talking. If you stop for 3 seconds, the recording ends.
An example answer
The line graph template, used on a real question. The PDF has an example answer for all 12 templates.
- This line graph shows Dubai gold sales in 2002, month by month, in millions of dirhams.
- Sales peaked in March, at about 350 million.
- After that, they fell steadily to about 120 million in July.
- Then they rose to just over 200 million in August, but dropped back to 120 million in September.
- Overall, sales went up and down, and ended the year at about 190 million, close to where they started.
- In conclusion, the best time for gold sales in Dubai seems to be early spring.
자주 묻는 질문
Are templates allowed in PTE Describe Image?
Which image types does the cheat sheet cover?
How do I use it in the 25 seconds?
How long should I speak in Describe Image?
Is the PDF free?
Describe Image template 받기